Why a Well-Powered Study Can Still Be Wrong
An Introduction to Bias in Research Design
How can a well designed study still be wrong?
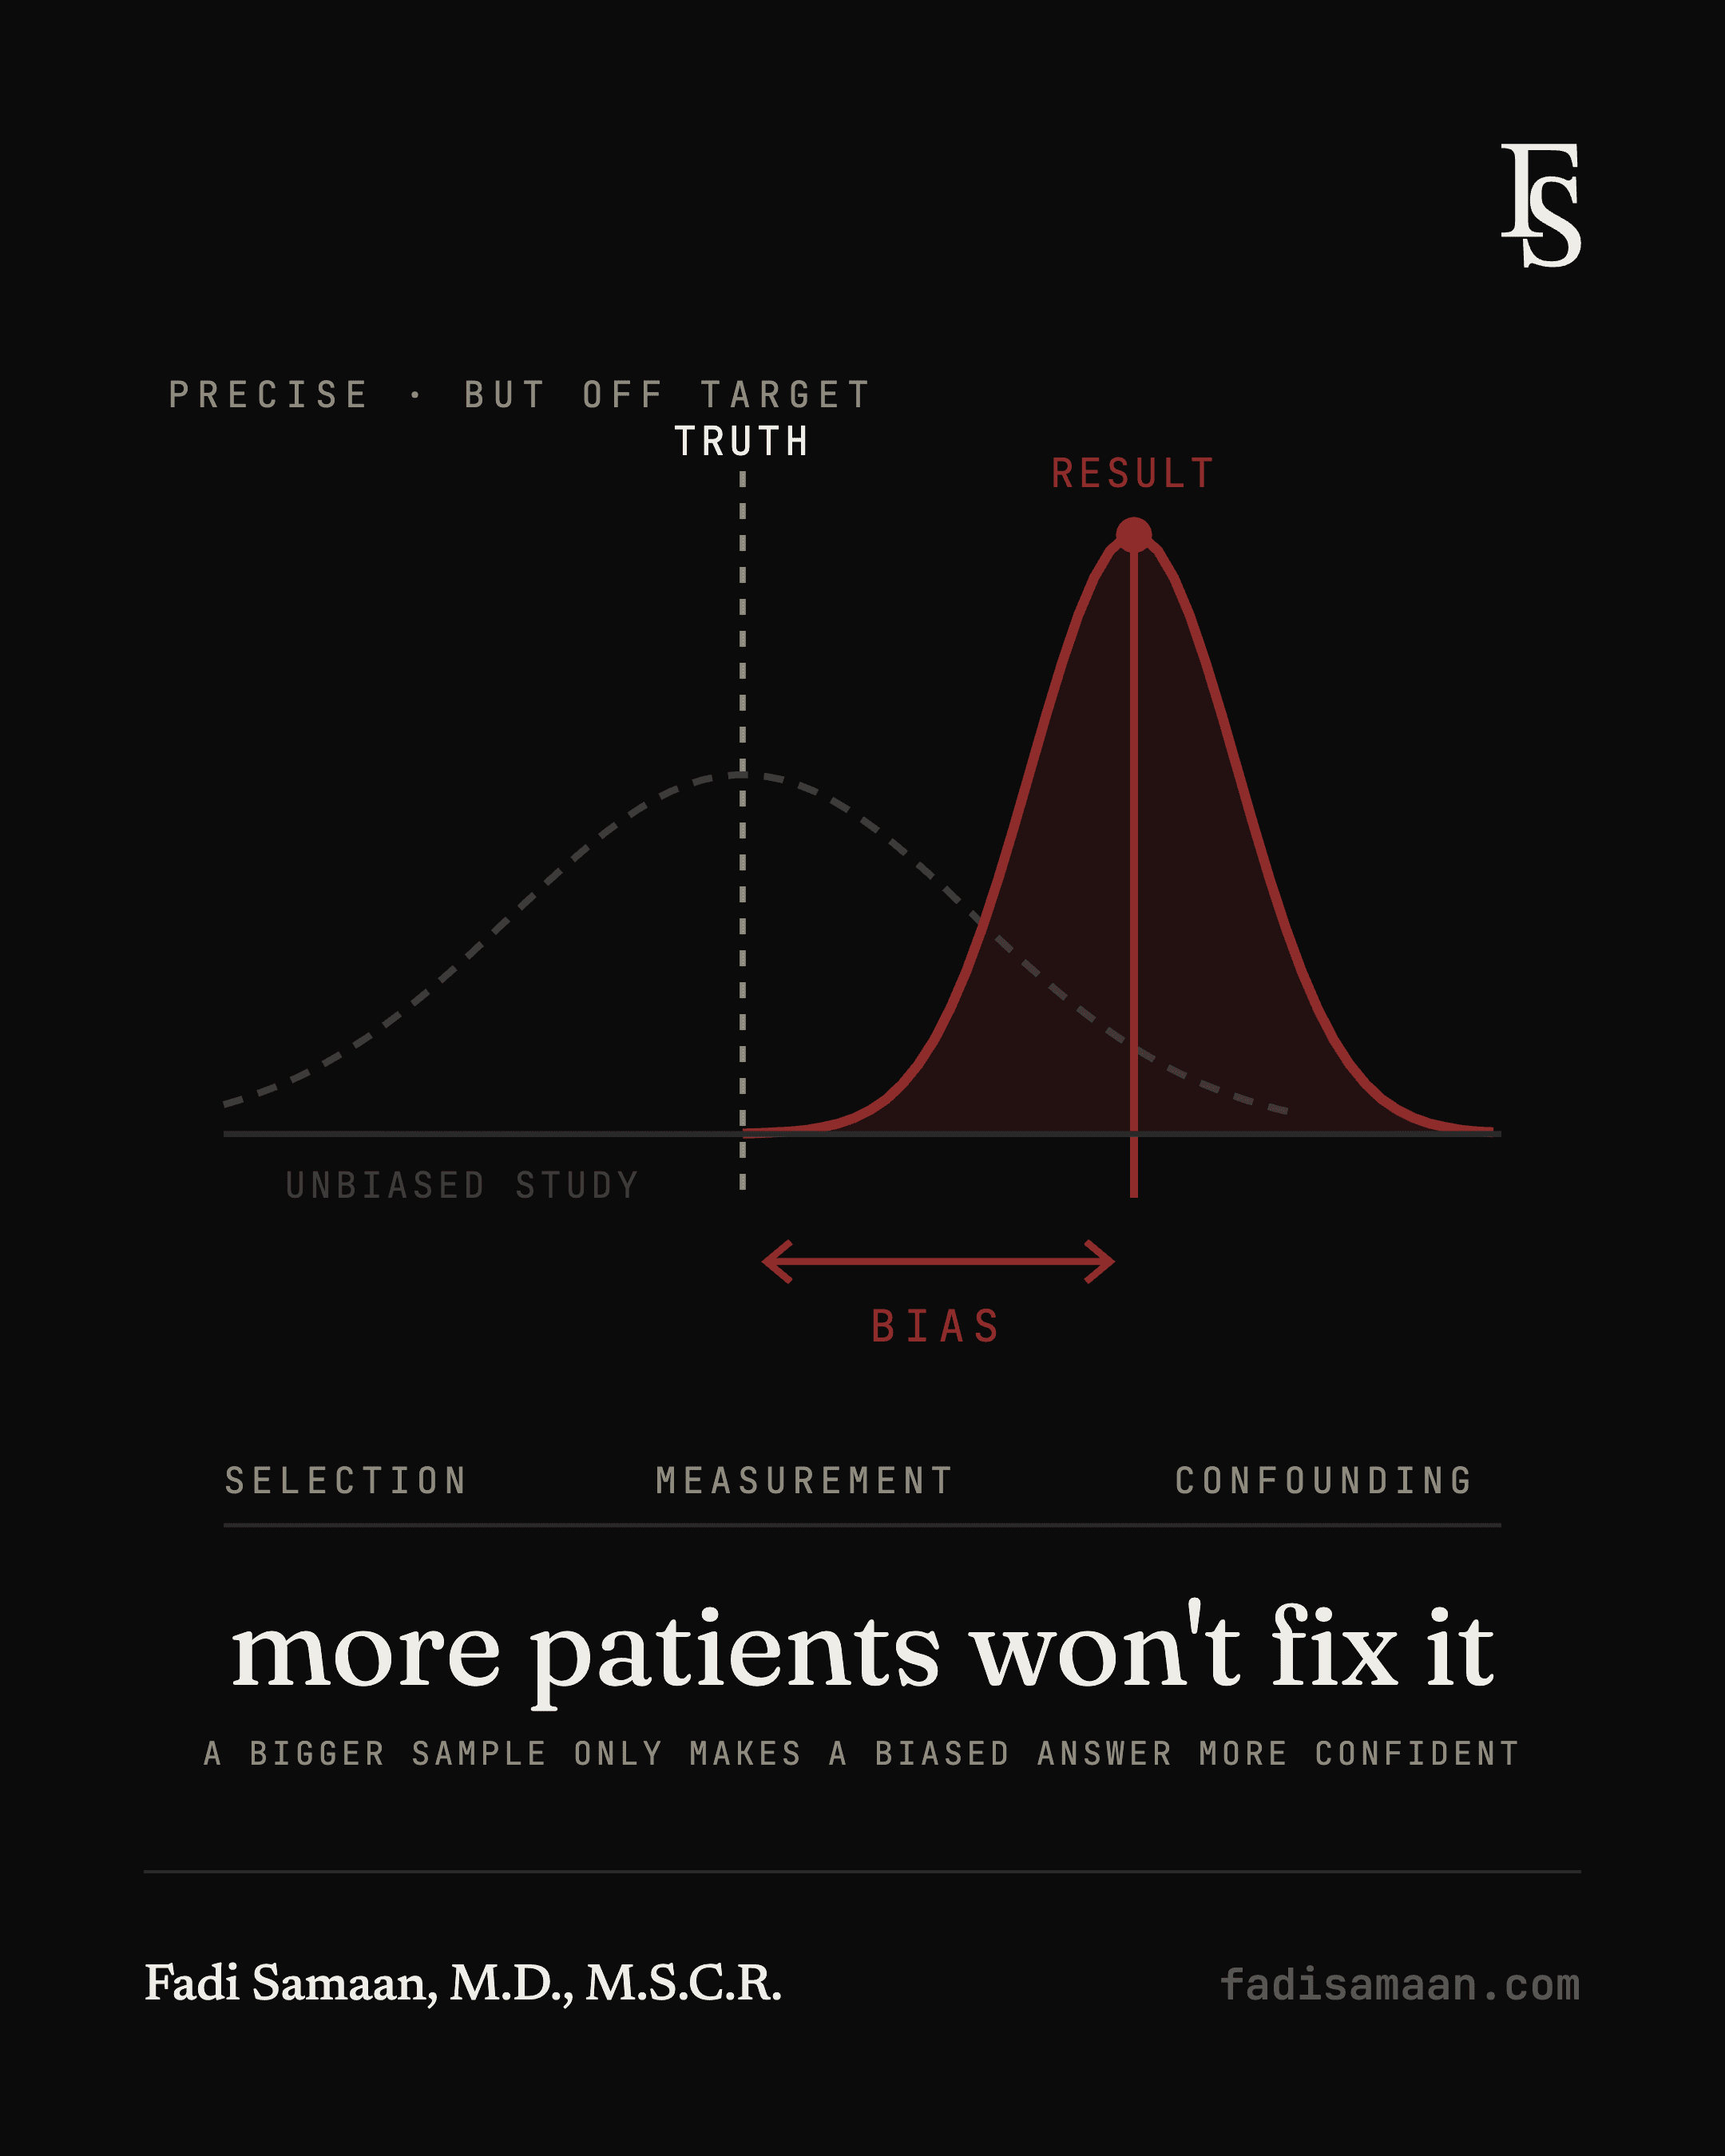
A study can enroll thousands of patients, land a tight confidence interval, and report a p value well under 0.05, and still point you toward the wrong answer. That is not a contradiction. Everything we have covered so far in this series, the p value, the confidence interval, statistical power, all deal with random error, the noise that comes from chance alone. A bigger sample shrinks that noise. But there is a second kind of error that sample size cannot touch at all: bias.
Bias is a systematic error, a design flaw that pushes the result in a consistent direction regardless of how many patients you enroll. Understanding the major forms of bias is what lets you read a study critically instead of just checking whether the p value cleared 0.05.
What bias actually means
Random error scatters your results around the truth in both directions; average enough trials together and it cancels out. Bias does not cancel out. It systematically shifts the result toward or away from the true effect, and it comes from how the study was designed and conducted, not from chance. A perfectly powered, statistically pristine study built on a biased design will simply be a very precise measurement of the wrong number.
Selection bias: who ends up in your study
Selection bias occurs when the people included in a study differ systematically from the people the conclusion is meant to apply to. A clinic studying a new therapy might draw patients healthy enough to travel for frequent follow up visits, quietly excluding the sicker patients who cannot make it in. The result looks better than what a typical patient would actually experience.
A classic version is the healthy volunteer effect: people who choose to enroll in research tend to be more health conscious than the general population, which can make an intervention look more effective, or a risk factor look less harmful, than it really is. Referral patterns cause a similar distortion. A specialty center sees a skewed slice of a disease, typically the more complex or unusual cases, so their outcomes data may not generalize to how that disease behaves in a typical primary care setting.
Confounding: the variable you did not measure
Confounding happens when a third factor is linked to both the exposure you are studying and the outcome you are measuring, creating an association that looks causal even when it is not. The often cited example is that people who drink more coffee have historically shown higher rates of heart disease. But for decades, heavy coffee drinkers were also disproportionately heavy smokers. Smoking, not coffee, was driving much of that association. Smoking status was the confounder, tied to both the exposure and the outcome, and it muddied the true relationship between coffee and heart disease.
Randomized controlled trials handle confounding well because randomization tends to spread both known and unknown confounders evenly across groups. Observational studies do not have that luxury. Researchers can statistically adjust for confounders they thought to measure, but they cannot adjust for the ones they did not think to collect, which is why observational data demands more scrutiny before anyone calls an association causal.
Information bias: when the data itself is flawed
Even with a representative sample and no confounding, a study can still be misleading if the information collected about patients is flawed or collected unevenly between groups. Recall bias is a common example: patients who experienced a bad outcome tend to think harder about their past exposures and remember them differently than patients who did not, even when the true exposure was identical. Measurement bias shows up when a diagnostic test or instrument performs differently across groups, for instance if one group is monitored more closely and therefore has more findings detected simply because someone was looking harder.
A well designed study protects you from bias before data collection ever starts. No statistical test afterward can undo it.
Key Takeaways
Random error is chance and shrinks with a bigger sample. Bias is systematic and a bigger sample does nothing to fix it.
Selection bias occurs when the people in a study differ systematically from the population the conclusion is meant to describe.
Confounding occurs when a third factor is tied to both the exposure and the outcome, making an association look causal when it may not be.
Information bias occurs when data collected about patients is inaccurate or collected unevenly between groups, through mechanisms like recall bias or measurement bias.
Reading a study well means asking who was included, how the exposure and outcome were measured, and what else could explain the result, not just checking the p value.
Up Next:
Next, we will take a closer look at confounding specifically, the single most common way an honest study can still point clinicians toward the wrong answer.